Using Landscape Regulations to Reduce Wildfire Risk
This technical guide was compiled by CPAW to help community planners and municipalities incorporate wildfire-related landscape regulations into their codes and land use practices.
Find tools, maps, charts, and information about wildfire risk for all U.S. communities, counties, tribal areas, and states.
Example land use planning tools for wildfire, including community plans, land development regulations, fire codes, and funding information.
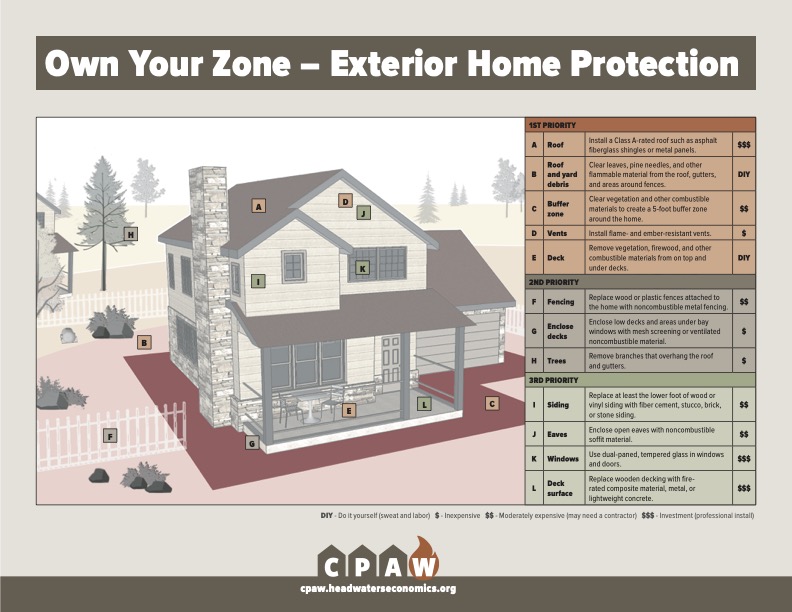
Illustration of the actions needed to make a home wildfire resistant.

Homeowner Brodey Simkins describes the tragedy of losing his home to wildfire and his commitment to rebuilding with wildfire in mind.
A report analyzing the costs of constructing homes to three levels of wildfire resistance in California.
This technical guide was compiled by CPAW to help community planners and municipalities incorporate wildfire-related landscape regulations into their codes and land use practices.
Headwaters Economics is running a program to help Colorado communities adopt and implement the state’s new Wildfire Resiliency Code. This is a free technical assistance program available to city and county governments and councils of governments.
This recorded webinar explores how crossover landscaping codes can do double duty to reduce fire risk and encourage water conservation in your community. An FAQ below the video includes answers to some of the questions raised by attendees.
This analysis offers homeowners in Hawai’i who want to rebuild and/or retrofit to higher wildfire resistance detailed cost estimates for upgrading a home’s exterior walls, roof, deck, windows and doors, eaves, gutters, and near-home landscaping.
A new home built to wildfire-resistant codes can be constructed for roughly the same cost as a typical home.
A report analyzing the costs of constructing homes to three levels of wildfire resistance in California.
See where wildfire risk intersects social and economic factors that can make it difficult for people to prepare for, respond to, and recover from wildfire.
Almost half of the full community costs of wildfire are paid for at the local level, including homeowners, businesses, and government agencies.
Explore the number of structures destroyed in each state by wildfire. Structures lost—rather than acres burned—provides a more complete measure of the broad impacts of wildfire.
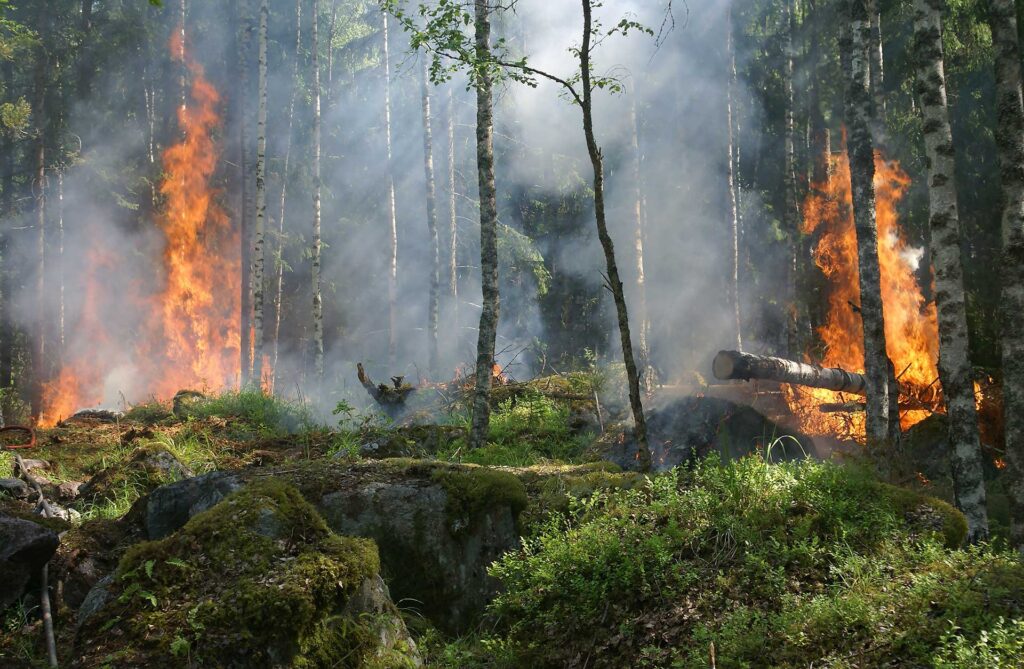
Wildfires are an inescapable and necessary function of healthy ecosystems. In the past decade they have increased in severity and duration, killed more people, and burned more structures.
Leaders from Austin describe how they came to realize the magnitude of the wildfire threat, and how they brought together diverse interests to pass one of the most forward-looking WUI codes in the U.S.
Homeowner Brodey Simkins describes the tragedy of losing his home to wildfire and his commitment to rebuilding with wildfire in mind.
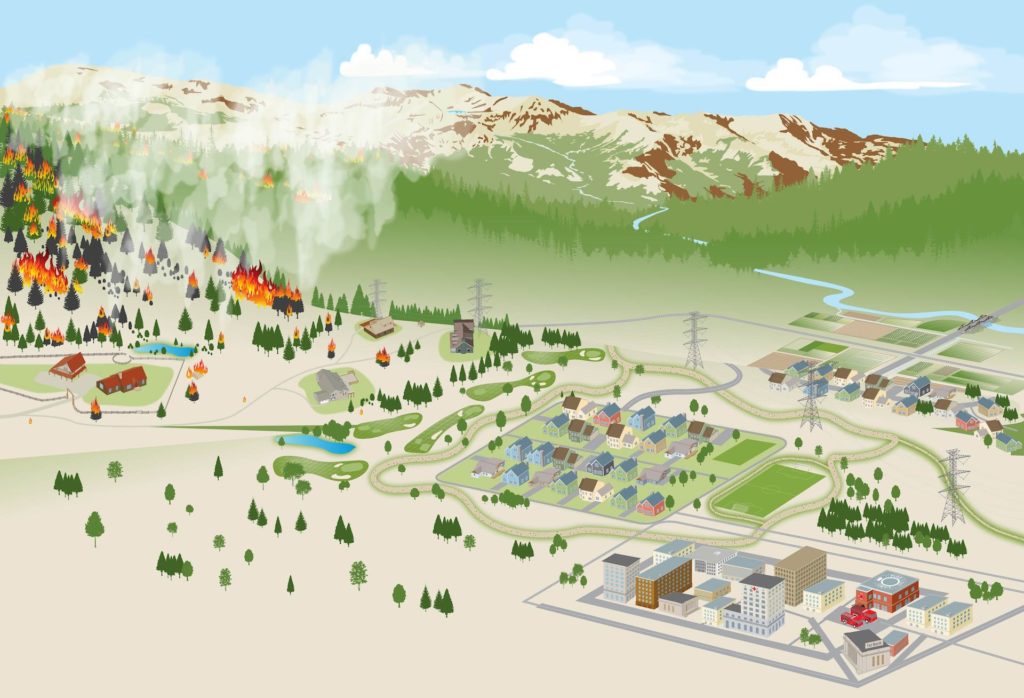
Illustration of how different land use planning tools can help reduce wildfire risk
Example land use planning tools for wildfire, including community plans, land development regulations, fire codes, and funding information.
Find tools, maps, charts, and information about wildfire risk for all U.S. communities, counties, tribal areas, and states.